
Export and reports
50.1Export image
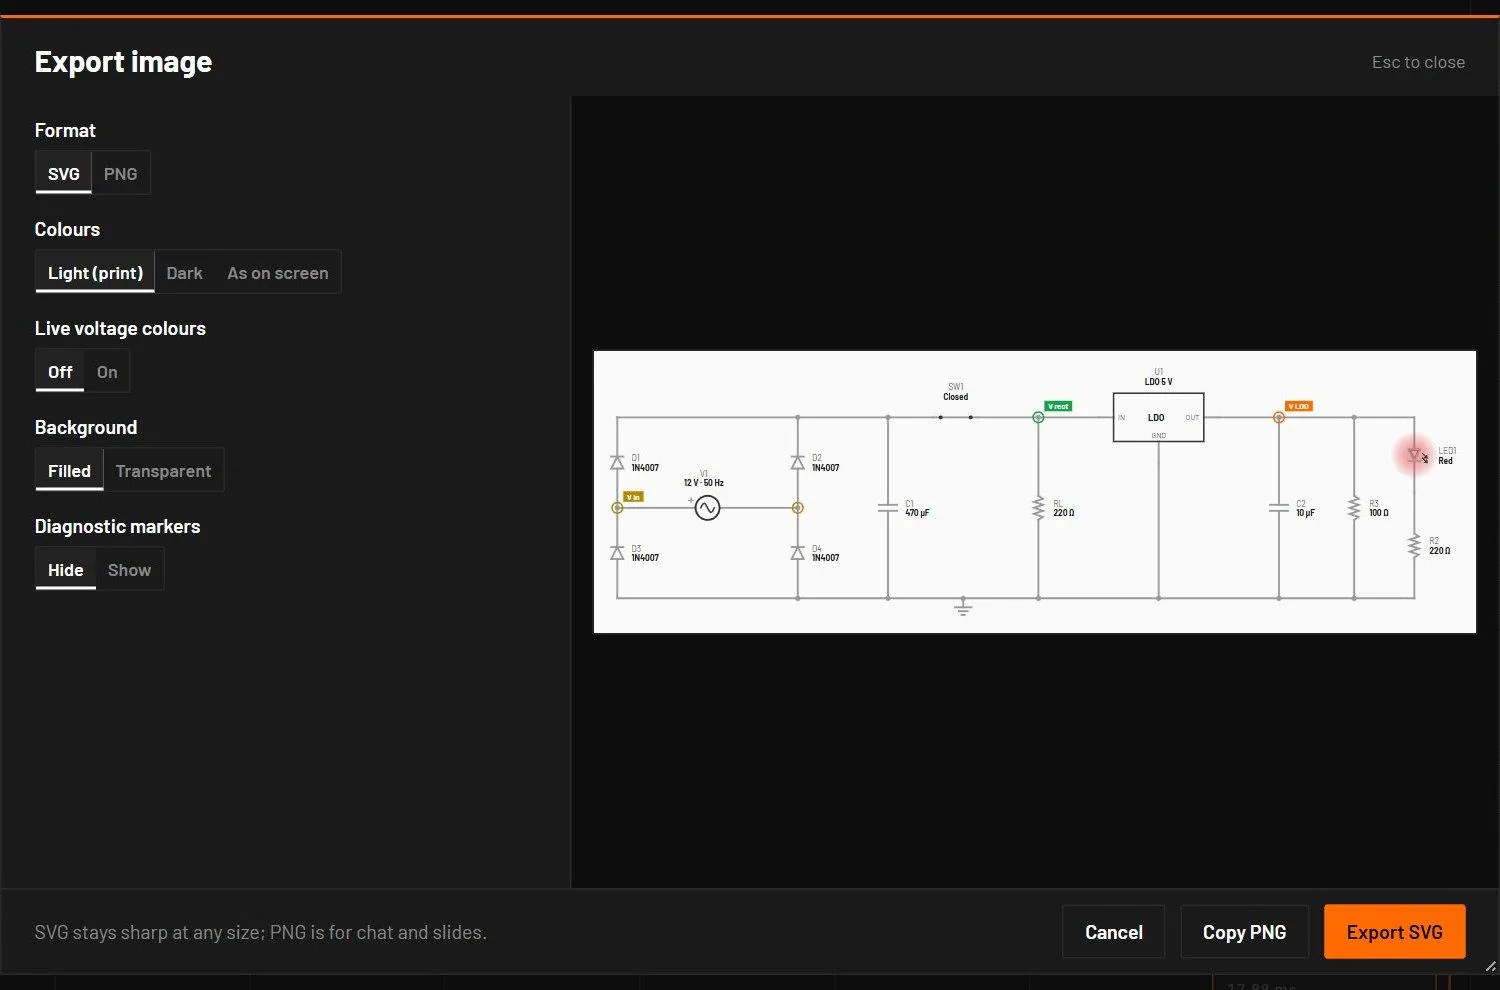
(Ctrl+Shift+P) saves a picture of the whole open sheet with a small margin, without the grid or the selection. The preview updates as you change the options.
| Field | Values | Default | What it does |
|---|---|---|---|
| Format | SVG, PNG | SVG | SVG stays sharp at any size, for documents. PNG is for chat and slides. |
| Colours | Light (print), Dark, As on screen | Light (print) | The colour theme of the picture. |
| Live voltage colours | Off, On | Off | Wires coloured by their present voltage, or neutral. |
| Background | Filled, Transparent | Filled | |
| Diagnostic markers | Hide, Show | Hide | Include the red and amber markers. |
| Resolution | 1x, 2x, 4x | 2x | PNG only. Pixels per screen pixel at 100 % zoom. |
The file is named after the circuit, for example rc-filter.svg or rc-filter@2x.png. A PNG is at most 16 384 px on a side, and a sheet too large for 4x is exported at the largest scale that fits, with a message. An empty sheet gives "Nothing to export: the sheet is empty."
50.2Export SPICE netlist

(Ctrl+Alt+N) writes the circuit as an ngspice netlist (.cir), with hierarchical sheets flattened. Parts that are only a symbol are left out and the message counts them. It also names sheets left out because their contents aren't loaded. From 0.7.0 it also writes comparators, the 555 and 556 timers, regulators of every kind, LDOs, supercapacitors, three-terminal capacitors, ferrite beads, crystals, resonators and varistors with the datasheet fields they carry, each checked against ngspice. From 0.8.0 the voltage-controlled switch exports with the engine's own smooth law and is compared point by point. Relays, manual switches, motors, self-heating thermal parts, memories and microcontrollers have no netlist equivalent. For a circuit with a vendor model, bspice export-spice writes the netlist Simulate runs, with the vendor libraries in their namespaces. If the export fails, the message gives the first problems with their fixes and the rest go to Diagnostics as E_EXPORT.
The example basics/rc-charge.bsc exports as:
* RC charge and discharge
* exported by bs-engine for ngspice
V1 IN 0 DC 0 PULSE(0 5e0 0 1e-6 1e-6 5e-3 1e-2)
R1 IN C1 1e3
C1 C1 0 1e-6
Every model parameter is written out, so ngspice's own defaults never change the result. Transmission lines export as T or LTRA elements. Behavioural parts (power blocks, controllers, most of the extended library) are written as comments, because ngspice has no equivalent.
50.3Generate report
(Ctrl+Shift+G) opens a short dialog. Tick the sections you want and press Generate. The file is one HTML page with the fonts inside it, so it opens the same offline. On screen it follows the app's theme. Printed to PDF it is always on white paper, with a page break before each section and no plot cut by a page edge. The plots are vector graphics, so they stay sharp at any zoom and in print.
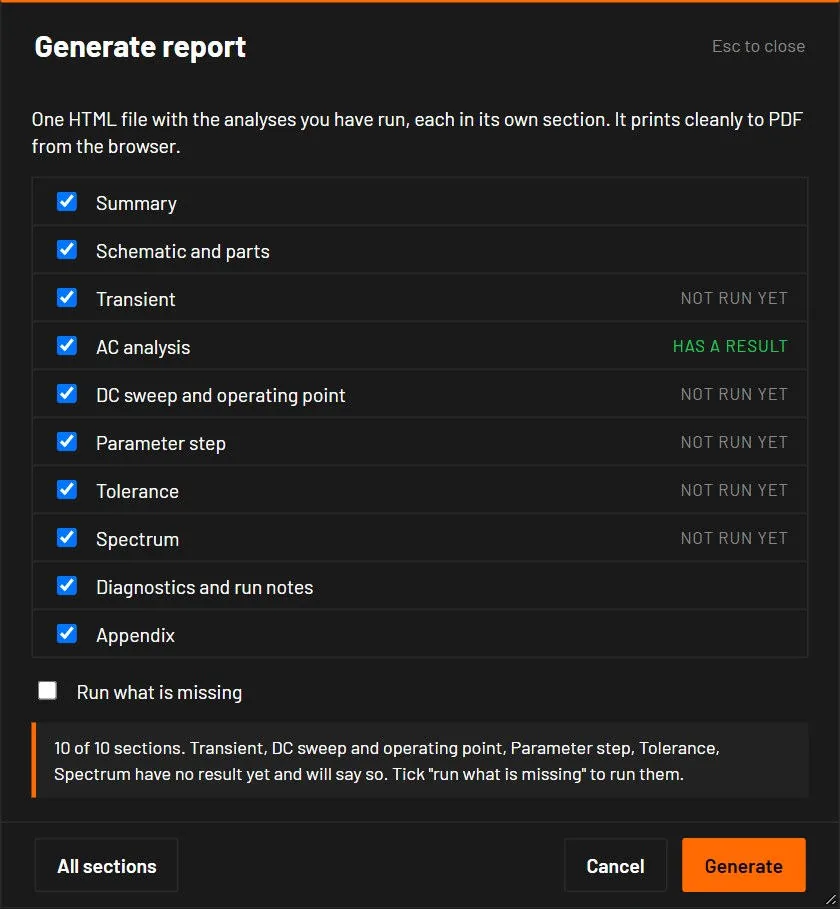
The report covers every analysis that has been run for the circuit in this session. Each one gets its own section.
| Section | What it holds |
|---|---|
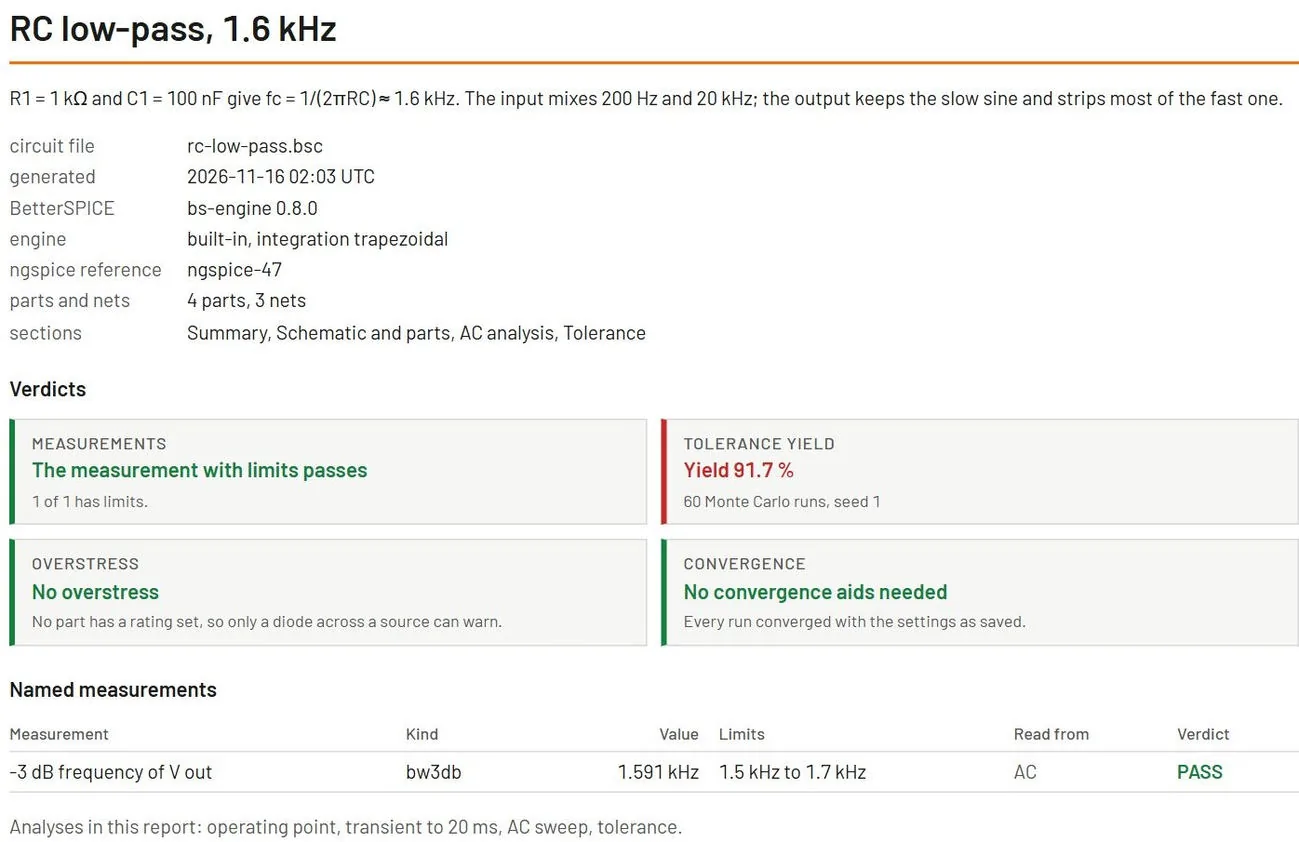
| Summary | The circuit name, the date, the BetterSPICE version and the engine. A table of every named measurement with its value, its limits and PASS or FAIL. Four verdicts in plain words with their numbers: all measurements pass, the tolerance yield, no overstress, and no convergence aids needed. |
| Schematic and parts | The schematic picture. The part list with values, tolerances, the model (vendor or generic, with its source) and the ratings that are set. The operating point of each part against its ratings, with the margin in percent. A margin under 20 percent reads LOW MARGIN, below zero reads OVER. |
| Transient | One plot per probe, the statistics of each signal, the named measurements, and the kept reference run drawn dashed behind the plot of the same signal. |
| AC | The Bode plots with the -3 dB points marked. For a loop gain, the 0 dB crossing, the phase margin and the gain margin. Gain and phase at each decade and at the frequencies your measurements name. |
| DC sweep and operating point | The operating point tables, and the DC sweep as a plot and a table. |
| Parameter step | The curves of every step overlaid on one plot per signal, and the measurements of each step in a table. |
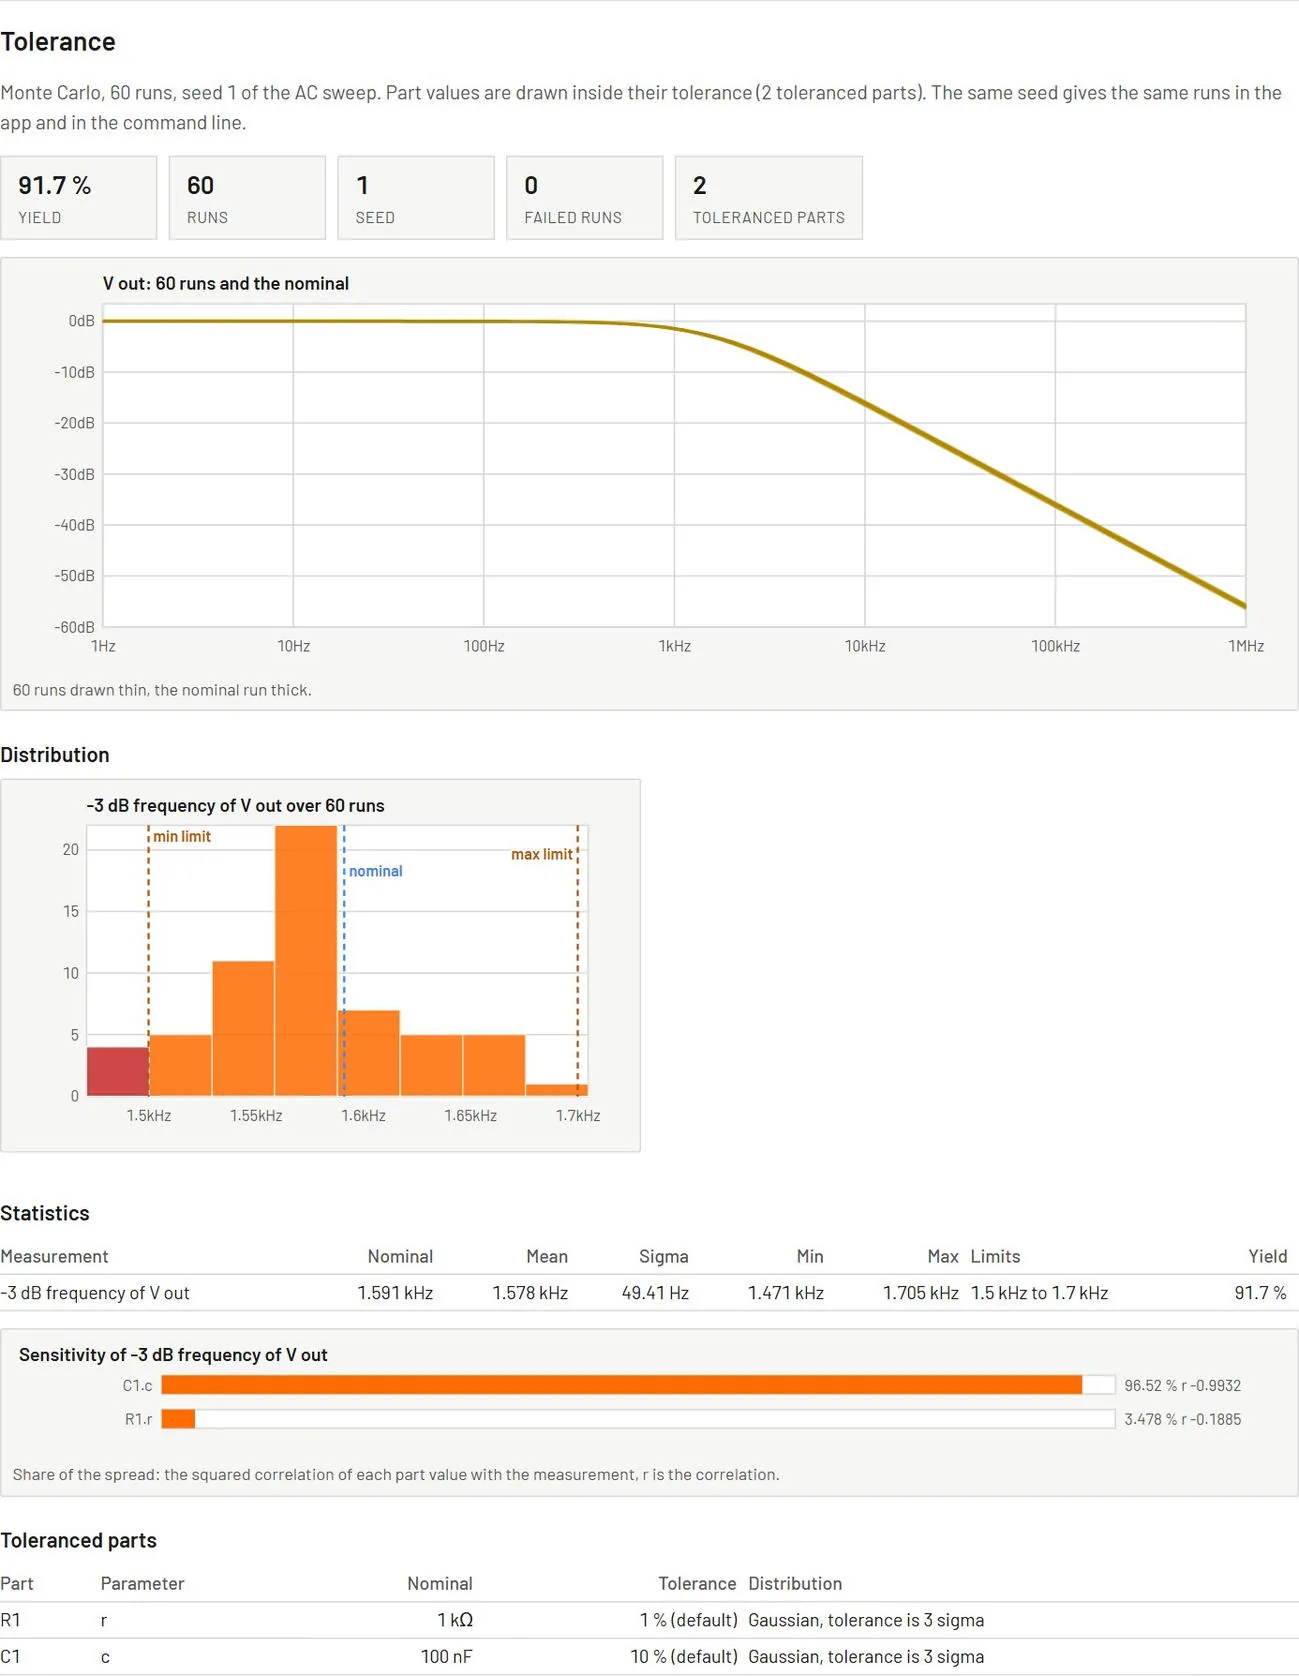
| Tolerance | The cloud of runs behind the nominal curve, a histogram of each measurement with its limits, the yield, the sensitivity bars, the statistics table, the toleranced parts, the seed and the number of runs. The same seed gives the same runs as in the app and in the command line. |
| Spectrum | The FFT of a probe with the window used, the harmonics table, and THD, THD+N, SNR, SINAD, SFDR and ENOB. The numbers come from the same code as the live FFT tab. |
| Diagnostics and run notes | Every warning and error with its fix, the notes of the convergence doctor, and the settings used (integration method, tolerances, step sizes, seed) so the result can be reproduced. |
| Appendix | The SPICE netlist, the simulation settings saved in the file, and the verification status of the device models used. |
In the app, a section is made from the analyses you have run in the session. A selected section with no result says so in a short note. Tick Run what is missing to run those analyses for the report, with the setup saved in the circuit or with defaults when it has none. The desktop asks where to save name-report.html, and the browser downloads it. The tolerance section needs parts with a tolerance. Measurements without limits cannot fail, so a circuit with none gets no yield. The overstress verdict can only warn about parts that have a rating.
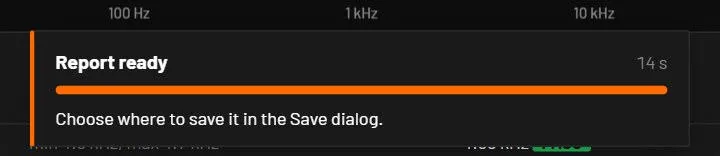
While the report is made, a panel at the bottom of the window shows the step it is on, the run within a tolerance or step analysis, a bar, the percentage and the time so far. Running the missing analyses can take a minute or more on a large circuit. Cancel stops the report after the current step or run, and nothing is saved. When the report is ready the panel reads Report ready while the Save dialog is open, and a message names the file once it is saved. A second Generate while one runs is refused with a message.
bspice report circuit.bsc --html out.html
bspice report circuit.bsc --sections summary,tol,spectrum --window blackmanharris --run-missing --theme light
bspice app get-report --sections tol --sections spectrum --out out.html
On the command line and in the agent tool there is no session, so the report includes the analyses the circuit file has a setup for and runs the others only with --run-missing. --sections takes any of summary, parts, tran, ac, dc, step, tol, spectrum, diagnostics, appendix. --theme is auto, dark or light. --fft names the probe for the spectrum and --window is hann, hamming, blackman, blackmanharris, flattop or rect.
50.4Share link and interactive HTML
puts the open circuit into a web address and copies it. The circuit travels inside the address, after the #, compressed. Nothing is uploaded and no server is involved. Whoever opens the link in a browser sees the circuit running in the The browser viewer. The dialog shows the link, its length and the viewer address it starts with. A link over 2000 characters is marked long, because some chat apps and forums cut those. A circuit that needs more than 60000 characters is too big for a link, and the dialog offers the two other ways. While the viewer address is the placeholder, the dialog makes no link and offers Export interactive HTML instead.
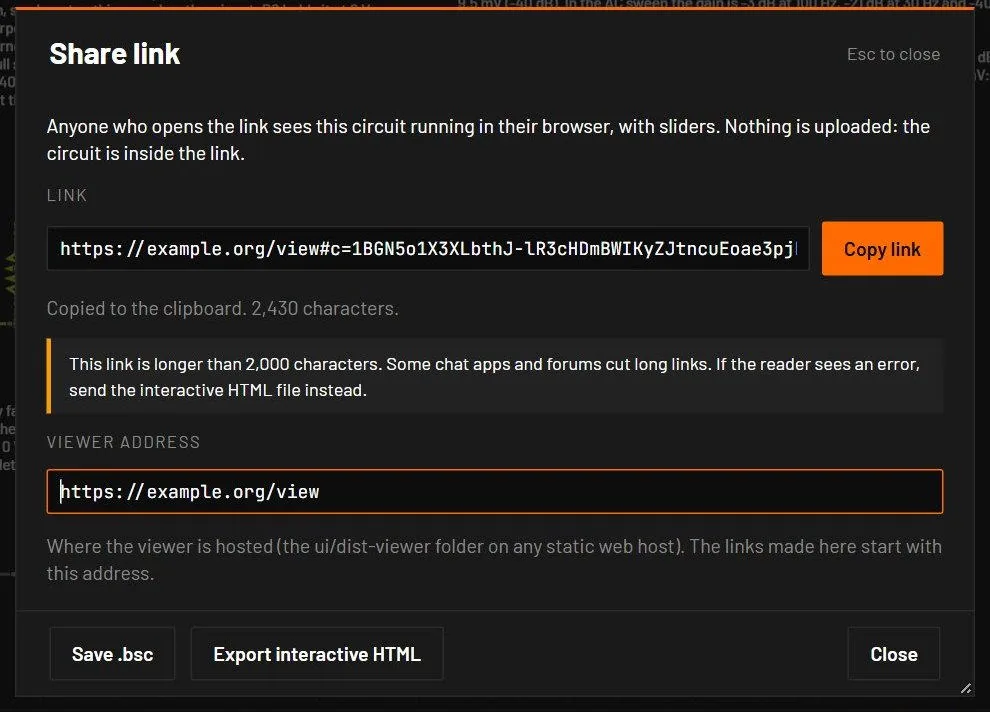
saves one .html file with the viewer, the engine and the circuit inside. It is about 3.7 MB, opens by double-click from disk and needs no network, so it works as an email attachment or on a forum that allows file attachments.
50.5Export data
| From | How | File |
|---|---|---|
| A scope | Right-click, Export CSV | scopeN.csv: time and one column per trace |
| The Analysis view | Export CSV in the plot toolbar | transient.csv, bode.csv, operating-point.csv |
| The Analysis view | PNG | The plot with its legend |
| The command line | bspice tran … --out f.csv | Any analysis to CSV |