
The window in detail
Every part of the window in detail. A tour of the window has the map with the ten numbered areas.
19.1The toolbar in detail

| Group | Controls |
|---|---|
| File | New, Open, Save, Import |
| Undo | Undo, Redo |
| Clipboard | Cut, Copy, Paste |
| Transform | Rotate, Mirror, Delete |
| Zoom | Zoom in, Zoom out, Zoom to fit |
| Draw | Select tool, Wire, Bus, Ground, Power flag, Probe. The active tool is highlighted. |
| Nets | Net label, Global label, Sheet port, Bus entry |
| Graphics | Text, Line, Rectangle, Circle |
| Run | Run / Pause. When the live engine stops on an error it becomes a red Halted button that opens Diagnostics. Then Step, Reset and the simulated time. |
| Timebase | Simulated time per real second: a slider, a field, a unit list (ps, ns, µs, ms, s) and "/s". Range 1 ps/s to 10 s/s. Timebase and speed explains it. |
| Current | Current dot speed, 0.01x to 100x, and Fit. Display only, the simulation doesn't change. |
| Timestep | The live engine's timestep, read only. |
| Simulate | Simulate for and max step are the Transient setup's stop time and maximum timestep. Simulate F5 runs it. An empty max step reads Auto with the step, for example Auto 50 µs: BetterSPICE picks it from the circuit (Auto maximum step). |
| .ac | Shows the AC range, for example 1 Hz–1 MHz. Click to open the AC setup. |
| .step | Shows the stepped parameter and the number of values, for example R1.r ×5. Click to open the step setup. |
When the window is narrow, the groups that matter least fold into a More tools menu first, and they come back as soon as there's room. Then the Simulate for and max step labels go (the fields keep their tooltips), then the file buttons and the bus, ground and power tools fold. The timebase and current sliders stay until after that: the current slider folds next, and only then does the timebase become a compact Timebase 10 ms/s ▾ button (a click opens the full slider, value and unit, and Esc or a click outside closes it). With room again, the timebase slider is the first thing to come back. Select, Wire, Probe and Meter probe never fold, and Undo and Redo fold last.
Number fields in the toolbar show the value with its unit, such as 200 ms. Click a field to select its value, type 200m, 0.2 or 1u, and press Enter. A second click places the caret. Esc cancels. Text that's not a number turns the field red and a message says what was kept, for example "Simulate for: "abc" is not a value (try 4.7k, 100n, 2.2u), kept 200 ms."
19.2The status bar in detail

| Item | Shows |
|---|---|
| Engine | Live MNA · WASM for the fast engine, Live MNA · native in the desktop app for a circuit of 100 parts or more (the same frames, about 1.4x as fast on a 578-part board), Live MNA · JS when the WebAssembly engine could not load and the slower JavaScript fallback runs, then · running, · paused or · halted (after an error). Live MNA · idle on an empty sheet. Hold the pointer over it for what the engine does. This is where the run state is shown: the canvas no longer has Running and Paused pills. |
| Accurate | Desktop: checking…, then ngspice 47 ready or ngspice not found. Browser: built-in engine. |
| Step | The live engine's timestep. |
| Cost | Microseconds of computer time per simulated step. |
| Nodes | The number of nets in the circuit. |
| Render | Frames per second while running, a dash when paused. |
| Threads | What may run side by side, always shown: Steps and tolerance 16 threads is how many threads parameter steps, Monte Carlo runs and the analysis pool may use. After a run it also says what that run used, for example Last run 1 thread (a transient goes step by step) or Last run 5 threads for a parameter step. Hold the pointer over it for the Threads setting and the reason a single transient uses one core: each time step needs the one before it (Threads). |
| Diagnostics | A red badge with the number of errors, an amber badge with the number of warnings, or none. The badge is red only when there's an error. Warnings alone are amber. Open pins are counted once your edits have paused for 1.5 s. Click it to open Diagnostics (Alt+6). |
| Hint | What the active tool does, for example "Wire: click to start, click to bend or end · double-click ends · Esc stops". With no tool active: "Ctrl+R run · . step · R C L D place · Ctrl+K everything · E examples". |
19.3Canvas overlays
The canvas shows only what needs your attention. The one state pill is the red Halted · code pill at the bottom left, which opens Diagnostics. Running and paused aren't drawn on the canvas: they are in the status bar and on the toolbar's Run / Pause button. The engine's description (MNA, Newton iteration, companion models, explained in How the live engine works) is the tooltip of the status bar's engine item. An AI agent at work adds the presence bar (Working with an AI agent). Inside a hierarchical sheet a breadcrumb sits at the top left (Hierarchical sheets and buses). The Overview button at the bottom right opens the minimap (Moving around).
19.4Tabs
Every open circuit has a tab above the canvas. The tab shows the file name, with a dot when there are unsaved changes, and the full path as its tooltip. The window title follows the active tab: name • - BetterSPICE, where the dot marks unsaved changes. What a tab says depends on where the circuit came from:
| The tab reads | It is |
|---|---|
| rc-lowpass.bsc | A circuit saved in a file. |
| untitled · not saved, untitled 2 · not saved, … | A new circuit that was never saved. Each new one gets the next number, so tabs never share a name. reuses an untouched empty untitled tab instead of opening another. |
| RC low-pass, 1.6 kHz · example | An example, named by its title. It's not your file: keeps a copy, and the first Save asks for a name. The menu bar says example (Save as to keep a copy) until you do. |
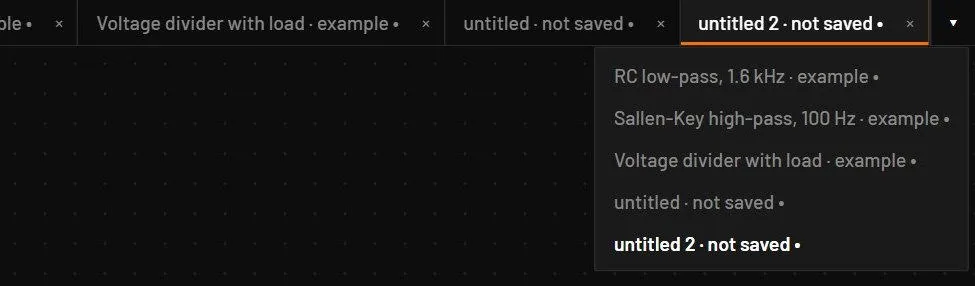
Double-click the tab of an unsaved circuit or an example to rename the circuit in place (one undo step). With many tabs, ‹ and › arrows appear at the ends of the tab strip and the active tab always scrolls into view. The down-arrow button (▾) at the right end of the strip lists every open circuit with its state and unsaved dot: pick one to switch to it.
Switching tabs keeps each circuit's live simulation as you left it: its traces, scope history, logic recordings, timebase, and whether it was running or paused. A circuit you open fresh always runs. BetterSPICE keeps up to four background tabs this way. A tab beyond that restarts from t = 0 when you return. The tool goes back to Select on a switch.
| To | Do this |
|---|---|
| Switch tab | Click it, or Ctrl+Tab and Ctrl+Shift+Tab. |
| Close a tab | Click its ×, middle-click it, or press Ctrl+W. A tab with unsaved changes asks Save, Don't save or Cancel in place. |
| Open a new tab | New (unless the open tab is an untouched empty circuit), Open, Import, opening an example while you have work open, crash recovery, files opened from Explorer and files dropped on the window all open new tabs. |
| See every tab | Click the down-arrow button at the right end of the tab strip, or use the ‹ and › arrows. |
| Rename an unsaved circuit | Double-click its tab, type the name and press Enter. |
19.5Views
| View | Key | Shows |
|---|---|---|
| Schematic | Ctrl+1 | The canvas and the dock. |
| Analysis | Ctrl+2 | Only the Analysis view: the result of the last analysis. |
| Split | Ctrl+3 | The schematic on top and the Analysis view below. In Split a plain click selects, drags and wires as in the Schematic view. Alt+click a net or a two-pin part adds its trace. |
Every way of starting a run shows its result the same way: F5, Ctrl+F5, F9, the analysis keys, and Run in the setup. From the Schematic view the window splits, so the schematic stays visible. In Split and Analysis the view stays as it is.
19.6Resizing panes
(Ctrl+B), (Ctrl+Shift+B) and (Ctrl+J) give the canvas more room. They are remembered, and a command that needs a hidden pane (a dock tab key, the library search, My parts) shows it again.
Every pane edge can be dragged: the library width, the inspector width (260 px to 45 % of the window), the Measurements height, the dock height and the split height. Double-click an edge to put that one back. Ctrl+F6 moves the keyboard focus to the next pane (library search, canvas, inspector or dock, skipping hidden panes) and Ctrl+Shift+F6 to the previous one. The pane's name is announced to screen readers. With an edge focused, the arrow keys move it by 16 px, with Shift by 64 px. The sizes are remembered, and sizes saved on a larger monitor are fitted to the window. puts every pane back.
19.7Themes and colours
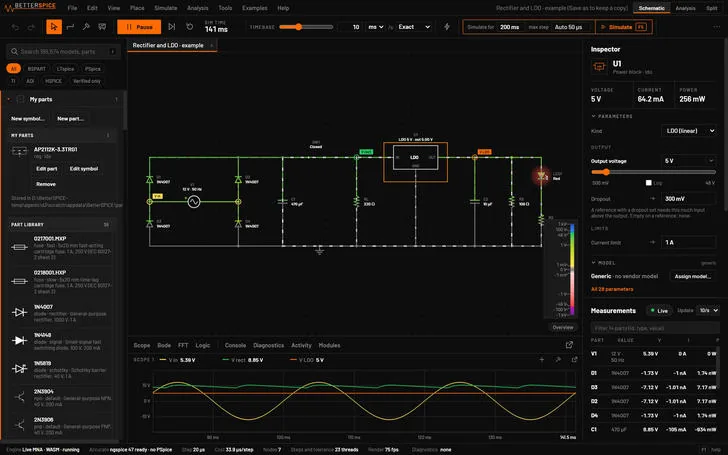
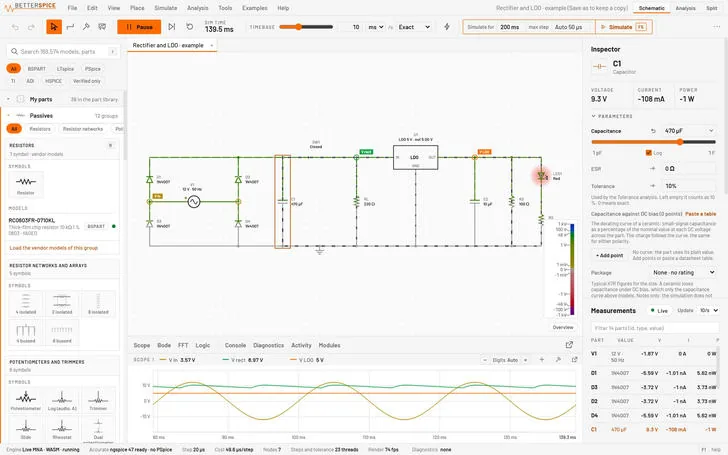
| Setting | Key | What changes |
|---|---|---|
| Light theme | Ctrl+Shift+L | The whole interface switches to a light background. The layout stays the same. |
| Live look | View, Live look | New (the default) or Classic, the look of version 0.3 and earlier. The look you pick is kept (Live look). |
| Voltage colours | Ctrl+Shift+K | Classic look only. Default: positive wires green, negative red, zero grey, current dots yellow. Design colours: positive orange, negative blue, zero grey, dots white. The colour saturates at the circuit's voltage range, 10 V by default. In the New look the entry is greyed out, because that look has one scale for every circuit. |
The theme, the live look, the voltage colours, the pane sizes, hidden panes, the current dot speed, the view mode, the dock tab, the library filter chips, the open library families and its scroll position are remembered for the next start. There's no separate settings dialog. Open, Save and Export dialogs start in the open file's folder, or the last folder you used.
19.8Messages
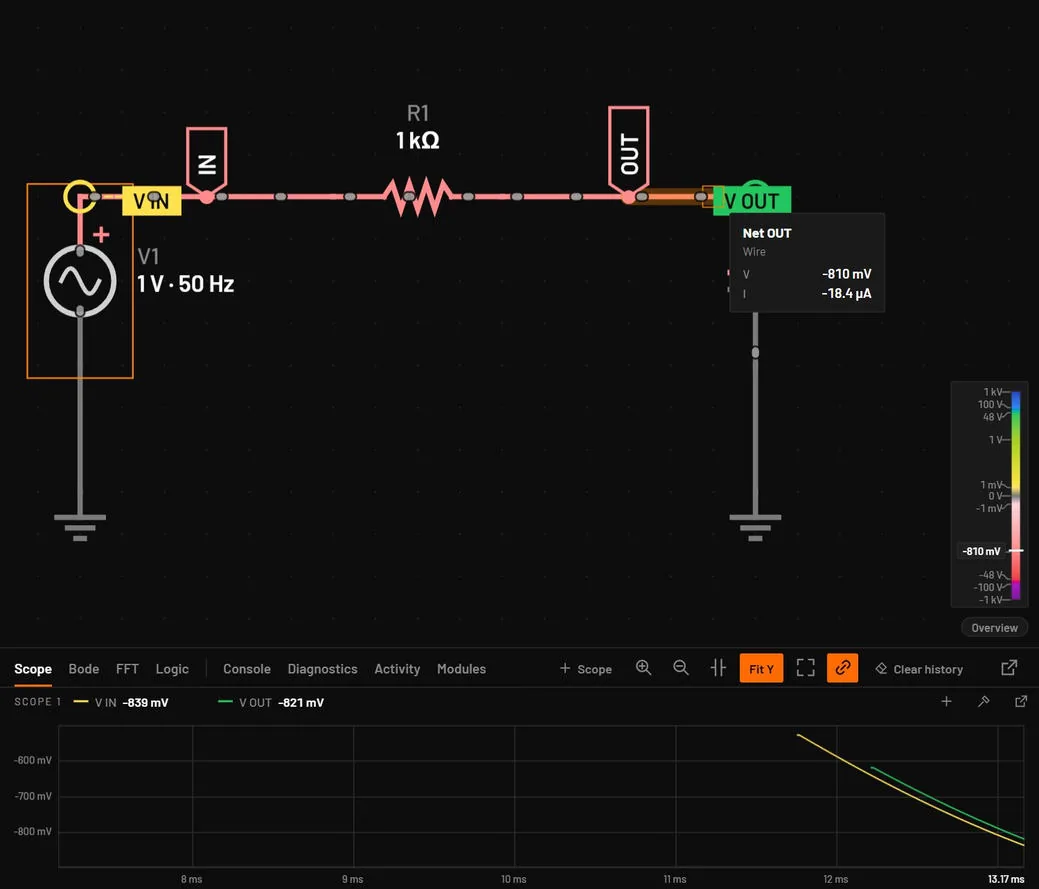
Short messages (toasts) appear at the top right of the canvas, up to three at a time. A coloured rule marks the kind: red for a failure. Some carry one button, such as Undo after Clear activity log, or Place now after a part is saved to My parts. Click a message to close it. It stays while the pointer is over it. Every message is also listed in Activity as a notice, so you can read it again later.
19.9What's new
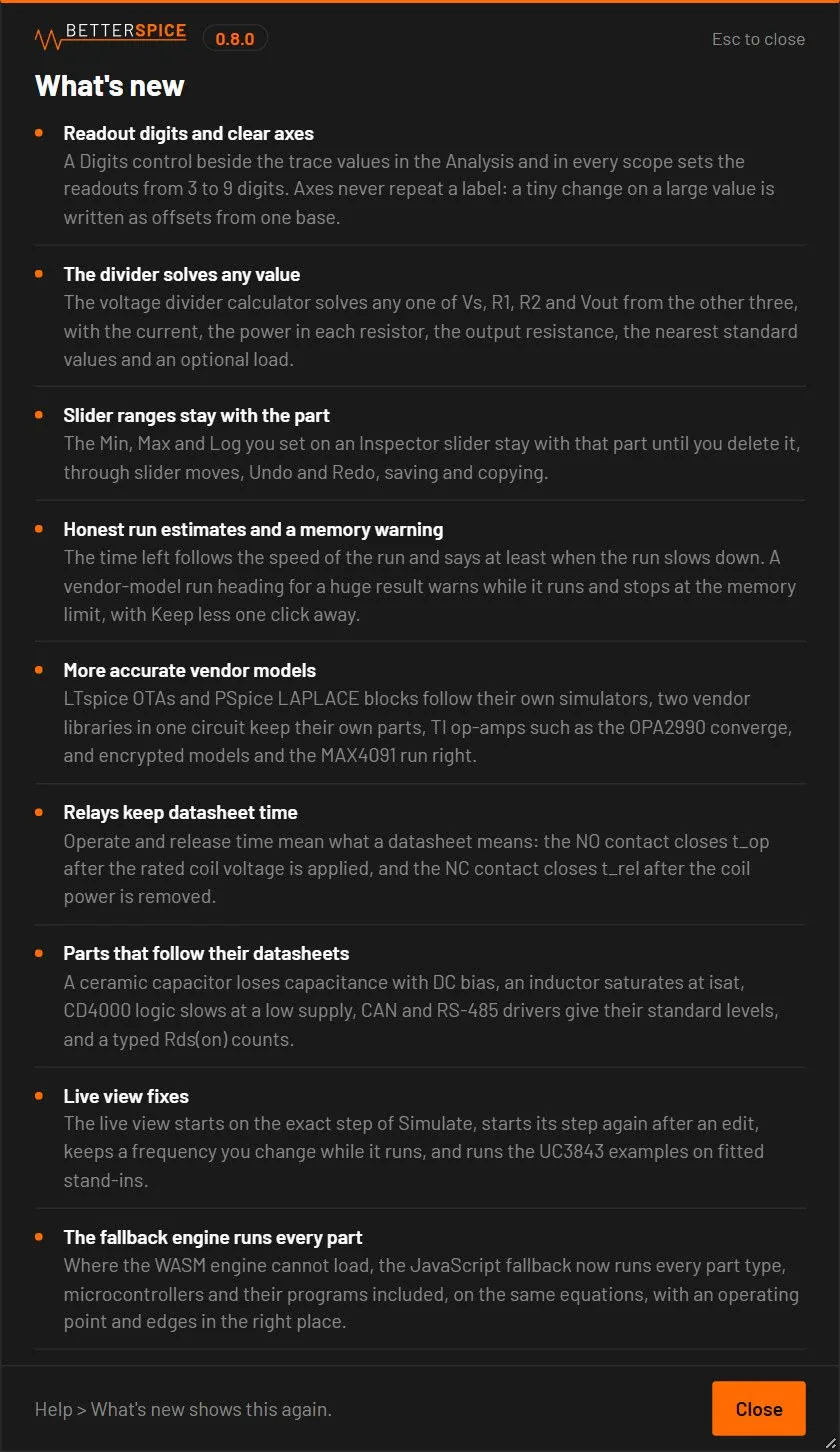
A short panel lists what a version brings. It opens by itself once, on the first start after the app's version changed, and it waits for any open dialog to close first. Close it with Close or Esc. opens it at any time. A patch release without notes shows nothing.
19.10Pop-out windows
The whole dock, any scope, all scopes together and the Analysis view can each move into their own window, which you can put on a second monitor. They show the same live data, with no copying. Close the window or press Dock back to return it. Keys pressed in a pop-out, such as Ctrl+R, reach the main window. Pop-outs close when the app closes.
19.11Start where you left off
The tabs you had open come back at the next start, in the same order, with the tab you were on in front. Saved files are read again from disk, and a file that is gone is skipped with a note. Examples and unsaved circuits come back from their kept text, still marked unsaved, and a note says so: "Reopened N unsaved circuit(s) from <time>. Save to keep it." With nothing to reopen, the app starts with a blank sheet. turns this off, for a blank start every time.
19.12Autosave and recovery
Every circuit with unsaved changes is copied to the app's storage 1.5 seconds after each change. If the app or the computer stops, the next start reopens those circuits in their own tabs, marked unsaved, with the message "Recovered N unsaved circuit(s) from <date>. Save to keep it."
In the desktop app, closing the window with unsaved tabs asks Save before closing BetterSPICE? with Save, Don't save and Cancel. Save saves every unsaved tab, asking for a name where there's none.