
03
Tutorial 2: Measure it exactly
The live simulation shows what a circuit does. To measure it, run it with Simulate. You'll take the filter from Tutorial 1, run a transient, measure the delay with cursors, find the −3 dB point and sweep the resistor. About fifteen minutes.
You needThe circuit from Tutorial 1: Draw an RC filter and watch it run, open and running. Or open the example RC low-pass, 1.6 kHz (E): it has the same R and C.
You will learnSimulate (F5), the Analysis view, cursors, the AC sweep, the parameter step and saving.
03.1Run a transient
- In the toolbar, click Simulate for, type
5mand press Enter.You should seeThe field reads 5 ms: the run covers the first 5 ms of the circuit's life. - Click max step, type
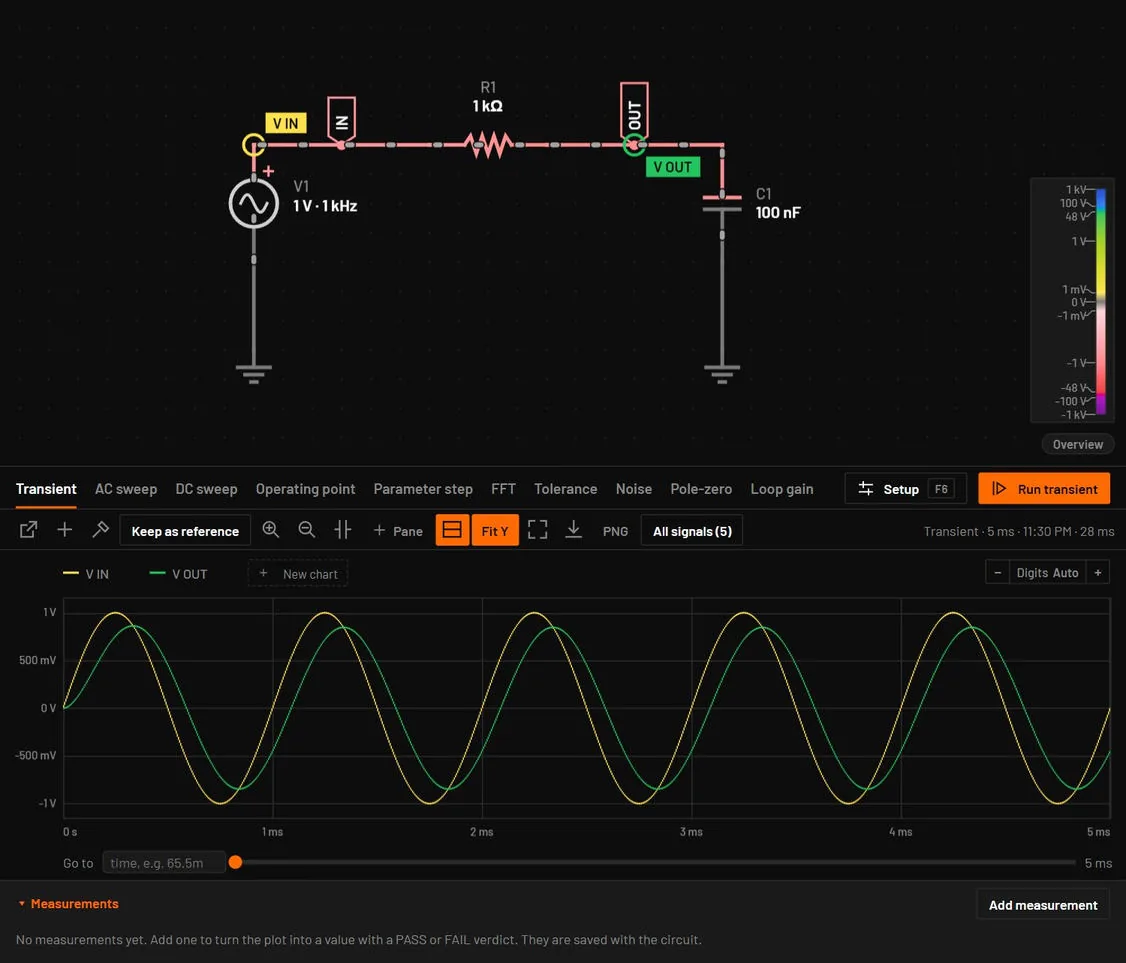
1uand press Enter.You should see1 µs: the solver never takes a longer step, so a 1 ms period gets at least 1000 points. - Press F5.You should seeThe view splits. The schematic stays on top and the Analysis view below shows V IN and V OUT from 0 to 5 ms. V OUT starts at 0 V and settles within about 0.5 ms (five time constants of 100 µs).If you seea banner that starts Simulation failed:, read the reason in it, press Dismiss, and go to Troubleshooting by symptom.
03.2Measure the delay with cursors
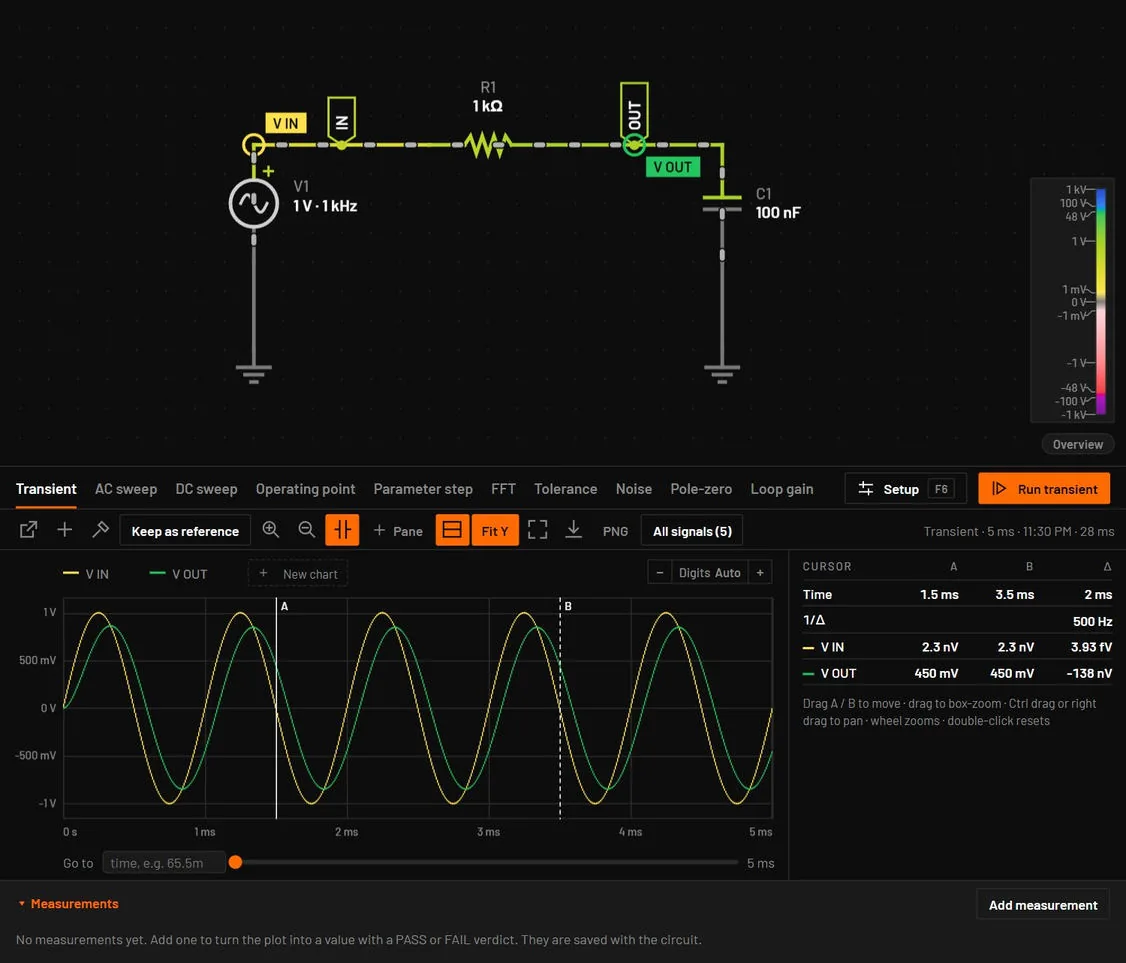
- Click Cursors in the plot toolbar.You should seeTwo vertical lines, A (solid) and B (dashed), and a readout on the right.
- Drag cursor A onto a peak of V IN, for example the one at 4.25 ms.
- Drag cursor B onto the next peak of V OUT.You should seeThe readout gives Δ of about 89 µs, and V OUT at B of about 0.85 V.
03.3Find the corner frequency
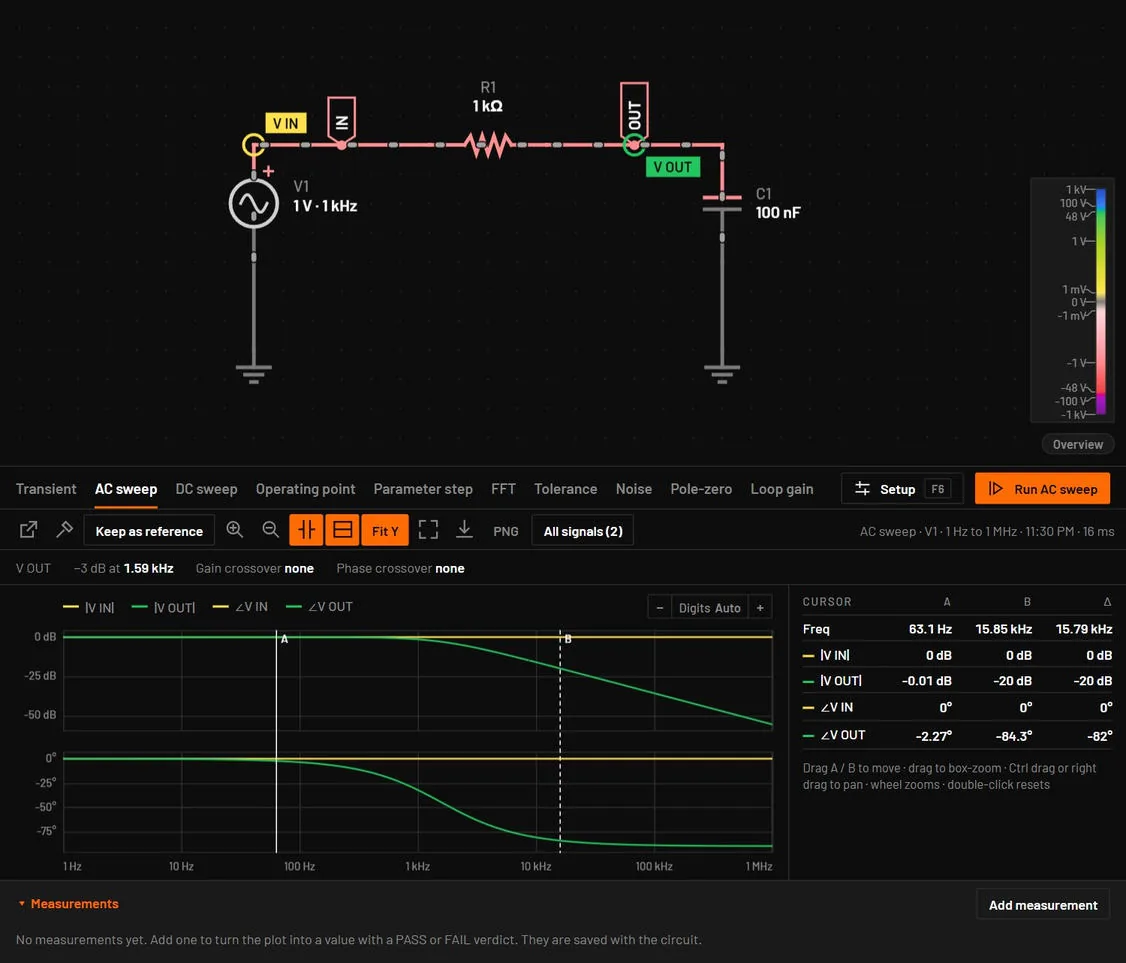
- Press F7.You should seeSimulation setup opens on the AC sweep tab, because this circuit has no AC setup yet. Input source is already V1, from 1 Hz to 1 MHz. The header says "F7 runs it from now on · F6 opens this setup".
- Click Run AC sweep.You should seeA Bode plot: gain flat at 0 dB, then falling 20 dB per decade, and phase going from 0° to −90°. The strip above it reads −3 dB at 1.59 kHz. The window stays split. The setup is saved in the circuit, so the next F7 runs the sweep at once.
03.4Sweep the resistor
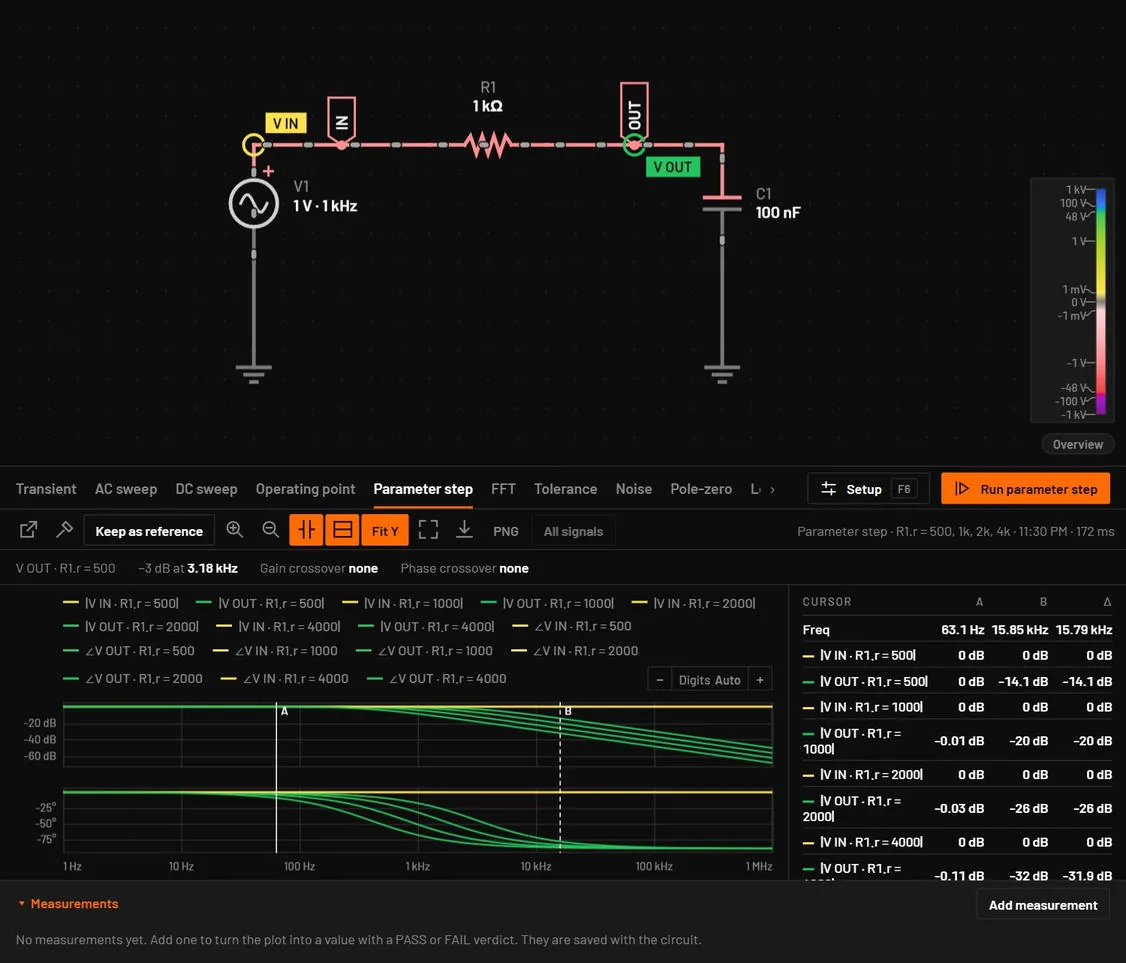
- Press Shift+F7.You should seeThe Parameter step tab opens, as the circuit has no step setup yet. Parameter is already
R1.r, the resistance of R1. - In Values, type
500, 1k, 2k, 4k. - In Analysis to repeat, choose AC sweep.
- Click Run parameter step.You should seeFour Bode curves named
V OUT · R1.r = 500and so on. Their corners are at about 3.18 kHz, 1.59 kHz, 796 Hz and 398 Hz: double R, half the frequency.
03.5Save
- Press Ctrl+S.You should seeA Save dialog opens. The browser version asks for the name in the window, then downloads the file.
- Type
rc-lowpassand press Enter.You should seeThe tab is named rc-lowpass.bsc and its unsaved dot is gone. The file keeps the parts, wires, probes and every analysis setting you used.
If your screen does not match
| If you see | Do this |
|---|---|
| A plot with no traces and No probes | Probe IN and OUT first (Tutorial 1), or hold Alt and click a net in the schematic above the plot. A plain click only selects. |
| The cursors are missing | Click Cursors in the toolbar of the plot, not in the dock. |
| A −3 dB point far from 1.59 kHz | Check R1 (1 kΩ) and C1 (100 nF) in the inspector, then press Ctrl+F5 to run the sweep again. |
| Only one curve after the parameter step | Separate the values with commas: 500, 1k, 2k, 4k. |
03.6What you did
You measured the filter three ways: a transient in time, an AC sweep in frequency, and a parameter step across four resistor values. How BetterSPICE thinks explains why BetterSPICE has both the live simulation and Simulate, and Simulate and measure has a page for each kind of measurement.