
07
A tour of the window
One window holds everything. There's no settings dialog: what you change is remembered.
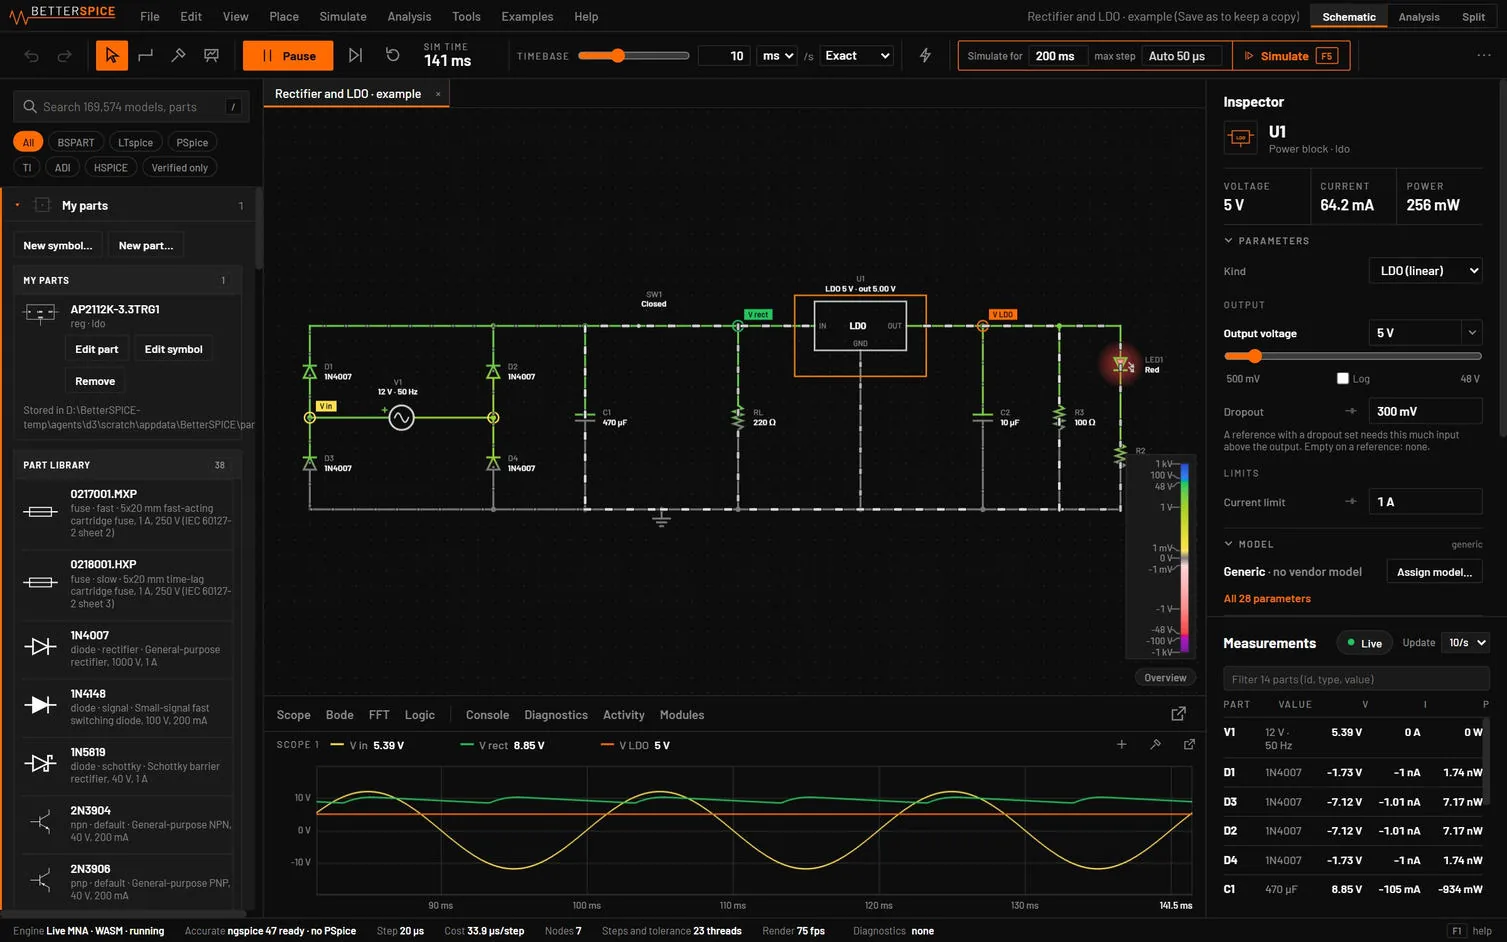 12345678910
| Area | What it's for | |
|---|---|---|
| 1 | Menu bar | File, Edit, View, Place, Simulate, Analysis, Tools, Examples, Help. On the right: the Follow AI switch, the circuit name with saved, edited, not saved or example (Save as to keep a copy), and the view switch. |
| 2 | Toolbar | File, undo, drawing tools, Run / Pause, Step, Reset, the circuit time, the timebase and the current dots. |
| 3 | Simulate group | Simulate for (stop time), max step and the Simulate button (F5). |
| 4 | View switch | Schematic, Analysis or Split. |
| 5 | Library | Search, source filters, My parts and the part families with their symbols and models. |
| 6 | Canvas | The schematic. While it runs, wire colour is voltage and moving dots are current. Hold the pointer over anything for its readings. |
| 7 | Inspector | The selected part: live readings, model, parameters with sliders. |
| 8 | Measurements | Every part with its value, voltage, current and power, live. |
| 9 | Dock | The Scope, Bode, FFT, Logic, Console, Diagnostics and Activity tabs. |
| 10 | Status bar | The live engine and whether it's running or paused, the timestep, the diagnostics badge and a hint for the active tool. |
07.1Signs of state
| You see | It means |
|---|---|
| running or paused after the engine name in the status bar | The live simulation is on, or paused (Ctrl+R). Nothing is drawn on the canvas for these two states. |
| A red Halted · code pill on the canvas and a red Halted button in the toolbar | The live simulation stopped on an error. Click either to open Diagnostics. This is the only state that's also shown on the canvas. |
| A number on the status bar's Diagnostics badge | Red when there's an error, amber when there are only warnings. Click it, or press Alt+6. |
| Live MNA · WASM · running in the status bar | The fast live engine. Live MNA · JS is the slower fallback for when the fast engine cannot load. idle instead of running: the sheet is empty. |
| ngspice 47 ready | Simulate can run vendor models (desktop). |
| A dot on a tab | Unsaved changes. BetterSPICE autosaves them for recovery anyway. |
| example after a tab name | An example you opened. It's not your file: Save as keeps a copy. |
| A violet AI · name | An AI agent is working in this circuit (Working with an AI agent). |
Every area is described in detail in The window in detail.